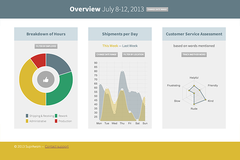
Today, it is practically impossible to offer a dashboard devoid of pictorial or graphical representations. Representation of the graphs, charts, and pictures enables the users to easily comprehend the large statistics or complex sets of data. Apart from that, a good graph enhances the look and feel of your web design.
In this blog post, I’ll be sharing Top 7 best JavaScript libraries which allow you to visualize your data in form of interactive charts and graphs. While most of them are open source, some might offer the paid versions with some additional features.
Let’s begin!
D3.js

Courtesy: https://d3js.org/
D3.js is the most popular JavaScript library for data visualization. D3 stands for Data Driven Document, It is written in javascript and uses functional style (i.e. you can reuse your code). D3 allows you to create visualization by dynamically updating the Document Object Model (DOM). D3.js uses HTML, SVG and CSS to visualize the data. D3 is best utilized when you work with heavy data, it is fast, supports large datasets. It follows W3C web standards and is compatible across browsers. D3.js is open-source and free for all users.
If you use npm, use the following command to install the D3, else you can download the latest release
The release bundle supports anonymous AMD, vanilla environments and CommonJS.
npm install d3
FusionCharts

Courtesy: http://shelterproject.naiaonline.org
FusionCharts is one of the most comprehensive JavaScript libraries with over 90+ charts and 1000+ maps. You can use any web scripting language with Fusion Chart like PHP, JavaScript, Ruby on Rails, ASP, etc. FusionCharts supports both JSON and XML data formats rendering can be via HTML5/SVG or VML. Exporting charts is allowed in PNG, JPG or PDF formats.
Advantages of using Fusion Chart:
1. Less load on your servers
2. Easy installation
3. Easy JavaScript integration
4. Simple and easy to use
5. Multiple platforms support
6.Large varieties of charts and maps
You can easily install the FusionCharts via npm package management software.
Google Charts

Courtesy: http://girlfromoutofthisworld.com
Google charts are based on HTML5/SVG and VML for an older version of IE. It provides widely used chart types like bar, area, pie and gauges. It is free to use, but not an open-source. According to Google’s licensing policy, it doesn't allow you to host their JS files on your server.
Note: IE8 doesn't support SVG and it's JavaScript doesn't allow trailing commas in lists. Apart from that, you can neither use the Google charts offline nor can you download, save or host the google.charts.load or google.visualization code.
Dygraphs

Courtesy: http://jeelabs.org
When dealing with extremely large data sets, Dygraphs offers the ultimate solution. It is interactive and highly customizable: using options and custom callbacks. It is free and boasts of an active community support for development. It has a strong support for error bars and an active community for development and support.
There are several ways to use Dygraphs
1.
<script src="//cdnjs.cloudflare.com/ajax/libs/dygraph/2.0.0/dygraph.min.js"></script>
<link rel="stylesheet" src="//cdnjs.cloudflare.com/ajax/libs/dygraph/2.0.0/dygraph.min.css" />
2. if you use npm type command npm install Dygraphs
3. git clone “ git clone https://github.com/danvk/dygraphs.git”.
Chart.js

Courtesy: https://webdesign.tutsplus.com
Chart.js is a small open source JavaScript charting library which uses HTML5 canvas element. It is responsive in nature and supports all browsers. It is best when dealing with small data sets as it supports the 6 chart types: line, bar, radar, polar, pie and doughnut. If you want to use cdn to use chart.js, then go to https://cdnjs.com/libraries/Chart.js , here you will find list of cdn to use chart.js. Otherwise, you can download the latest release at https://github.com/chartjs/Chart.js/releases/tag/v2.5.0
Highcharts.js

Courtesy: http://community.protoshare.com
Highcharts is like FusionCharts as it also provides a large range of charts and maps. The key difference is that it provides a different package for stock charts called Highstock. It is written in pure Javascript. Exporting charts is allowed in PNG, JPG, SVG and PDF formats. It doesn’t matter which license you are using free or not, you can download the source code and make your own modifications. One of the biggest advantages of using Highchart is, it’s compatibility with older browsers from IE6. It has a multitouch support on touchscreen based platforms like android and iOS it also supports Zooming chart to view data more precisely.Highcharts is Free for non-commercial but paid for commercial use.
Chartist.js

Courtesy: https://github.com
When it comes to simple and responsive charts, Chartist.js is the solution. Chartist’s charts are fully responsive and DPI independent. Charts can be used on any device and it is based on SVG which also makes it future compatible. Chartist helps you draw "Simple Responsive Charts" using inline-SVG in the Document Object Model (DOM), CSS to style and JavaScript to provide an API for configuring your charts. It is open-source and free for all users.
To download and setup guide go to https://gionkunz.github.io/chartist-js/getting-started.html
What’s your favorite JS charting library, and why? Share your thoughts in the comments below.


1 Comment(s)