In this blog, I am going to Guide you about tonal range. Lets first start by understand what is tonal range and how to use it? It is the range of tones between the lightest and darkest areas of an image. The tonal range of an image represents the amount of contrast and distribution of pixels, ranging from the darkest pixels (black) to the lightest pixels (white). So we can correct the image contrast using the Levels command.
Please follow the below steps to implement the tonal range:
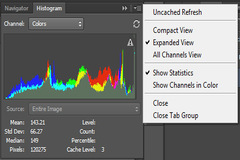
1.Choose Window > Histogram, or click the Histogram tab in the Navigator palette group to make it visible. Then choose Expanded View on the palette menu, as shown in below image


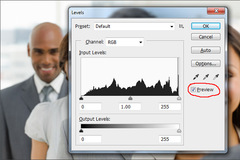
2.Go to top level menu > Image > Adjustments > Levels, to open the Levels dialog box.
3.Make sure that the Preview check box is selected, and then move the dialog box, if necessary, so that you can also see the image window and Histogram palette.

Three triangles below the histogram represent, first the shadows is represented by black triangle, Second is highlights which represented by white triangle, third and last one midtones or gamma is represented by gray triangle. If your image had colors across the entire brightness range, the graph would extend across the full width of the histogram. Notice that at this point, the graphs in the Levels dialog box and the Histogram palette are identical.
A. Shadows B. Midtones or gamma C. Highlights

4.Drag the left triangle to the right to the point where the histogram indicates that the darkest colors begin.
As we drag, the first Input Levels value (above the histogram) changes and so does the image itself. In the Histogram palette, the left portion of the graph now stretches to the edge of the frame. This indicates that the darkest shadow values have shifted closer to black.
5.Drag the right triangle to the left to the point where the histogram indicates that the lightest colors begin. Again, notice the changes in the third Input Levels value and in the image and the changed shape of the Histogram palette graph.
6.Drag the middle triangle a short distance toward the left side to lighten the midtones.
Watch the image updates in the image window and the changes in the Histogram palette graph to determine how far to drag the middle triangle.
7.When the image looks good to you (the sample uses Input Levels values of 18, 1.30, and 232), click OK to apply the changes. Then save your work.
0 Comment(s)