Hi Friends,
Debugging precompiled assemblies into some meaningful and understandable code is not an easy task without proper tools. Visual Studio ships with a tool named "IL Disassembler" and it does the task for taking a look at the structure of the code but that too provides only a structural idea of the code and getting it work like we use "Go To Definition(F12)" in our Visual Studio is not an easy task.Forget about debugging with this.
Following is the link if you want to get some info about IL Disassembler:
http://www.dotnetperls.com/il-disassembler
So If you get a third party tool which has some glitch or you want to write similar functionality but customized to your organizational needs you need to understand the code flow first. And If you get the debugging and and code in a proper readable and understandable format, the task becomes easier.
So we can use .Net Reflector for the same purpose. Net reflector is a tool which is used to decompile the assemblies to understand their flow whether you have the source code or not. It integrates with visual studio well so debugging and decompiling at the very place with which you are so well versed is possible and easy. So Let's get to the process.
1- Install the .Net Reflector (It's a 14 day fully functional trial until you pay for it).
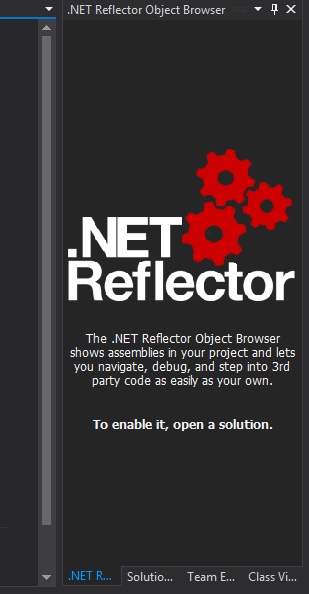
2- Open your Visual Studio(I am using VS2013) and you can see the following pane .

2- So it says to open a solution, open one.
as soon as you open the solution you see that it shows "The .Net Reflector Browser is being refreshed."
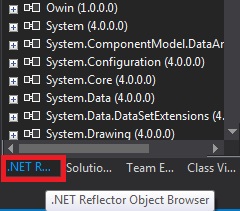
3- And now a new tab ".Net Reflector Object Browser" is shown to the left of your solution explorer and it shows all of your decompiled assemblies ready to be debugged like following:

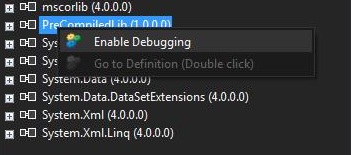
4- Now that we've got the assemblies and I've a a assembly named "PrecompiledLib", I want to debug this so
5- We will right click on the library and click on "Enable Debugging". This will tell the Reflector to generate a PDB file(Program Database File-A file which holds debugging and project state information.For more info click here.) if a corresponding one doesn't exist.And when a PDB is created you are ready to go step through the code of assembly.

6- When the process is finished,you can debug your library methods just like other code files you're working on.

Now that we've got the steps of debugging a precompiled library using .Net Reflector, there are some points to be noted:
1- Reflector is not free. If you like it ,buy it.
2- If you don't like it (obviously paying 95$ or above is not the first option we think about when we think of any third party tool in this open source world and that too for the product which used to be free. ), there are several options which are open source and you can use them without any upfront or hidden price.
One of the most used tools is ILSpy . The idea is more or less the same. For any reference please take the this blog into account.
Other helpful decompilers are as following.
JustDecompile
DisSharper
dotPeek
Kaliro
Mono Cecil
Common Compiler Infrastructure
Dotnet IL Editor (DILE)
Thank you.
Happy Coding:-)
0 Comment(s)