Memory leak is a situation when a computer program starts managing memory allocation incorrectly in a way that the resources or a memory which is not anymore in use and needed is not released. In this tutorial, we will learn "How to Find a JavaScript Leak in Node.Js?"
We know that node.js is built on Google’s V8 engine. So memory allocation and deallocation to node.js process handled by Google V8 java script engine. Let's first see "how Garbage Collection is done by V8 engine?".
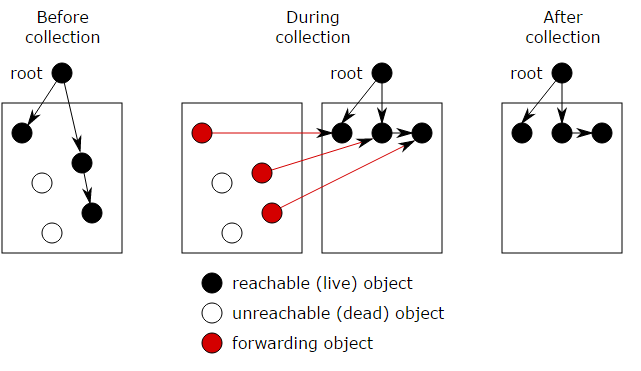
Javascript V8 engine keeps memory graph for each object and variables used in node js program. Periodically it searches in memory graph to find which node is reachable and which is unreachable from root node, if any node found unreachable from root it released that memory, assuming that data is no longer used in program.

Image source: memorymanagement.org
Let's have nodejs app with lot of memory leaks. Then our garbage collector trigger again and again to free memory for node process, node stops program execution when performing a garbage collection cycle and because we have many memory leaks in app, hence our app will crash.
const http = require('http');


var server = http.createServer((req, res) => {

 for (var i=0; i<2000; i++) {

   server.on('request', function leakymemory() {});

 }


 res.end('node js memory\n');

}).listen(2000, '127.0.0.1');

server.setMaxListeners(0);


console.log('Your erver running at http://127.0.0.1:2000/. ');
In above code every request makes 2000 more leaky listeners to memory.
To simulate these request we use NPM module autocannon. If you don't have autocannon installed in your system, use below command:
npm i g autocannon
MEMORY LEAK DETECTION BY MEMWATCH
Node- memwatch is module for find memory leaks in Nodejs code. It fire A leak event when code is leaking memory.
INSTALLING MEMWATCH
memwatch is very easy to install, just type following command in terminal:
npm install save memwatch next
add memwatch to code
const memwatch = require (mamwatch-next);
also add event listener for leak memory
memwatch.on(leak,(info)){

console.error(detected memory leak,info);

});
After adding memwatch in code, the final code inside index.js will be like below:
const http = require('http');

const memwatch = require('memwatch-next');


var server = http.createServer((req, res) => {

 for (var i=0; i<1000; i++) {

   server.on('request', function leakymemory() {});

 }

 memwatch.on('leak', (info) => {

  console.error('Memory leak detected:\n', info);

});


 res.end('node js memory\n');

}).listen(2000, '127.0.0.1');

server.setMaxListeners(0);


console.log('Server running at http://127.0.0.1:2000/. ');
now to show the result open one terminal and run fallowing autocannon command
autocannon -c 1 -d 60 http://localhost:2000
now open another terminal and run
node index.js
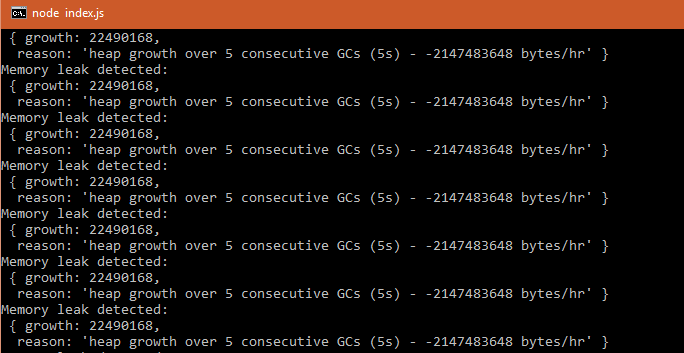
you will see below output:

CROME DEV TOOLS
Chrome dev tool is to debug your code. To learn more about Chrome dev tool you can visit below link:
https://developers.google.com/web/tools/chrome-devtools/
To inspect code from chrome’s dev tool you need to type following command in terminal:
Node inspect index.js
Now open your chrome and take heap snapshot, make sure that snapshot is taken after some time interval.
After taking 2-3 heap snapshots, compare them in dev tools, while comparing, you will come across a leak memory function, named as leakmemory(). This leakymemory() function creates cluster objects, which is the root cause of the problem.
0 Comment(s)