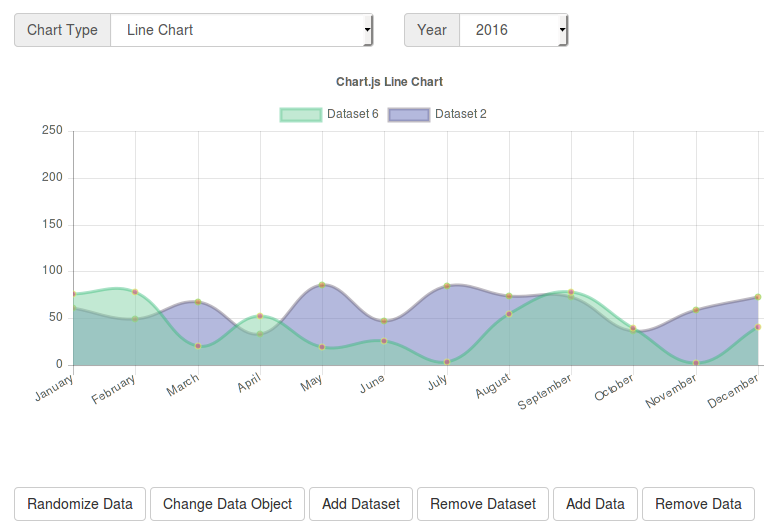
“You can have data without information, but you cannot have information without data” so when you have data then you might want to represent it by so many popular way. Someone prefer Table to represent data, someone use most creative way to represent data using Chart that is visually appealing.
Today you going to learn how to create simple yet flexible chart in Joomla using light weight chart library ChartJs.

For the demo purpose i have created one Joomla component named chartjs located in ROOT/components/com_chartjs.
First thing come first so at first add jQuery and chart.js in joomla view, If you want to these js is common in all view then it is better to add it inside chartjs.php located in ROOT/components/com_chartjs/chartjs.php
To add javascript file in joomla you need to write this code with proper path
$doc = JFactory::getDocument();

$doc->addScript('http://cdnjs.cloudflare.com/ajax/libs/jquery/2.1.3/jquery.min.js');

$doc->addScript('https://cdnjs.cloudflare.com/ajax/libs/Chart.js/2.1.4/Chart.min.js');
Now you have added requied library for creating chart, remember chartjs uses jQuery so dont forget to add jQuery before chartJs
Now write some html in view to create canvas in ROOT/components/com_chartjs/views/tmpl/default.php
<div class="row">

	<div class="col-xs-6">
		<div class="form-group">
			<div class="input-group">
				<div class="input-group-addon">Chart Type</div>
				<select class="form-control" id="jform_chart_type" name="jform[chart_type]">
					<option value="line" selected="selected">Line Chart</option>
					<option value="bar">Bar Chart</option>
					<option value="horizontalBar">Horizontal Bar</option>
					<option value="radar">Radar Chart</option>
					<option value="polarArea">Polar Area Chart</option>
					<option value="pie">Pie Chart</option>
					<option value="doughnut">Doughnut Chart</option>
					<option value="bubble">Bubble Chart</option>
				</select>
			</div>
		</div>
	</div>
	<div class="col-xs-3">
		<div class="form-group">
			<div class="input-group">
				<div class="input-group-addon">Year</div>
				<select class="form-control" id="jform_year" name="jform[chart_year]">
					<option value="2016" selected="selected">2016</option>
					<option value="2015">2015</option>
					<option value="2014">2014</option>
					<option value="2013">2013</option>
					<option value="2012">2012</option>
					<option value="2011">2011</option>
					<option value="2010">2010</option>
					<option value="2009">2009</option>
				</select>
			</div>
		</div>
	</div>
</div>


<div style="width:100%;">
	<canvas id="canvas"></canvas>
</div>
<br>
<br>
<button class="btn btn-default" id="randomizeData">Randomize Data</button>
<button class="btn btn-default" id="changeDataObject">Change Data Object</button>
<button class="btn btn-default" id="addDataset">Add Dataset</button>
<button class="btn btn-default" id="removeDataset">Remove Dataset</button>
<button class="btn btn-default" id="addData">Add Data</button>
<button class="btn btn-default" id="removeData">Remove Data</button>
Now our HTML is ready so now lets dig into Javascript to give final shape.
<script>
	var MONTHS = ["January", "February", "March", "April", "May", "June", "July", "August", "September", "October", "November", "December"];

	var randomScalingFactor = function() {
		return Math.round(Math.random() * 100);
            //return 0;
        };
        var randomColorFactor = function() {
        	return Math.round(Math.random() * 255);
        };
        var randomColor = function(opacity) {
        	return 'rgba(' + randomColorFactor() + ',' + randomColorFactor() + ',' + randomColorFactor() + ',' + (opacity || '.3') + ')';
        };

        var config = {
        	type: '<?php echo $this->params->get('chart_type', '') ?>', // getting chart type from component parameter
        	data: {
        		labels: ["January", "February", "March", "April", "May", "June", "July"],
        		datasets: [{
        			label: "My First dataset",
        			data: [randomScalingFactor(), randomScalingFactor(), randomScalingFactor(), randomScalingFactor(), randomScalingFactor(), randomScalingFactor(), randomScalingFactor()],
        			fill: false,
        			borderDash: [5, 5],
        		}, {
        			hidden: true,
        			label: 'hidden dataset',
        			data: [randomScalingFactor(), randomScalingFactor(), randomScalingFactor(), randomScalingFactor(), randomScalingFactor(), randomScalingFactor(), randomScalingFactor()],
        		}, {
        			label: "My Second dataset",
        			data: [randomScalingFactor(), randomScalingFactor(), randomScalingFactor(), randomScalingFactor(), randomScalingFactor(), randomScalingFactor(), randomScalingFactor()],
        		}]
        	},
        	options: {
        		responsive: true,
        		title:{
        			display:true,
        			text:'Chart.js Line Chart'
        		},
        		tooltips: {
        			mode: 'label',
                },
                hover: {
                	mode: 'dataset'
                },
                scales: {
                	xAxes: [{
                		display: true,
                		scaleLabel: {
                			display: true,
                			labelString: '<?php echo $this->params->get('labelString_xAxes', ''); ?>'
                		}
                	}],
                	yAxes: [{
                		display: true,
                		scaleLabel: {
                			display: true,
                			labelString: '<?php echo $this->params->get('labelString_yAxes', ''); ?>'
                		},
                		ticks: {
                			suggestedMin: 0,
                			suggestedMax: 250,
                		}
                	}]
                }
            }
        };

        $.each(config.data.datasets, function(i, dataset) {
        	dataset.borderColor = randomColor(0.4);
        	dataset.backgroundColor = randomColor(0.5);
        	dataset.pointBorderColor = randomColor(0.7);
        	dataset.pointBackgroundColor = randomColor(0.5);
        	dataset.pointBorderWidth = 1;
        });

        window.onload = function() {
        	var ctx = document.getElementById("canvas").getContext("2d");
        	window.myLine = new Chart(ctx, config);
        };

        $('#randomizeData').click(function() {
        	$.each(config.data.datasets, function(i, dataset) {
        		dataset.data = dataset.data.map(function() {
        			return randomScalingFactor();
        		});

        	});

        	window.myLine.update();
        });

        $('#changeDataObject').click(function() {
        	config.data = {
        		labels: ["July", "August", "September", "October", "November", "December"],
        		datasets: [{
        			label: "My First dataset",
        			data: [randomScalingFactor(), randomScalingFactor(), randomScalingFactor(), randomScalingFactor(), randomScalingFactor(), randomScalingFactor()],
        			fill: false,
        		}, {
        			label: "My Second dataset",
        			fill: false,
        			data: [randomScalingFactor(), randomScalingFactor(), randomScalingFactor(), randomScalingFactor(), randomScalingFactor(), randomScalingFactor()],
        		}]
        	};

        	$.each(config.data.datasets, function(i, dataset) {
        		dataset.borderColor = randomColor(0.4);
        		dataset.backgroundColor = randomColor(0.5);
        		dataset.pointBorderColor = randomColor(0.7);
        		dataset.pointBackgroundColor = randomColor(0.5);
        		dataset.pointBorderWidth = 1;
        	});

            // Update the chart
            window.myLine.update();
        });
		$('#jform_chart_type').change(function() {
			var chart_type = $(this).val();
			console.log(chart_type);
			config.type = chart_type;
			console.log(config.type);


        	config.data = {
        		labels: ["January", "February", "March", "April", "May", "June", "July"],
        		datasets: [{
        			label: "My First dataset",
        			data: [randomScalingFactor(), randomScalingFactor(), randomScalingFactor(), randomScalingFactor(), randomScalingFactor(), randomScalingFactor(), randomScalingFactor()],
        			fill: false,
        			borderDash: [5, 5],
        		}, {
        			hidden: true,
        			label: 'hidden dataset',
        			data: [randomScalingFactor(), randomScalingFactor(), randomScalingFactor(), randomScalingFactor(), randomScalingFactor(), randomScalingFactor(), randomScalingFactor()],
        		}, {
        			label: "My Second dataset",
        			data: [randomScalingFactor(), randomScalingFactor(), randomScalingFactor(), randomScalingFactor(), randomScalingFactor(), randomScalingFactor(), randomScalingFactor()],
        		}]
        	};

	        $.each(config.data.datasets, function(i, dataset) {
	        	dataset.borderColor = randomColor(0.4);
	        	dataset.backgroundColor = randomColor(0.5);
	        	dataset.pointBorderColor = randomColor(0.7);
	        	dataset.pointBackgroundColor = randomColor(0.5);
	        	dataset.pointBorderWidth = 1;
	        });

			// Update the chart
	        window.myLine.update();
		});
        $('#addDataset').click(function() {
        	var newDataset = {
        		label: 'Dataset ' + config.data.datasets.length,
        		borderColor: randomColor(0.4),
        		backgroundColor: randomColor(0.5),
        		pointBorderColor: randomColor(0.7),
        		pointBackgroundColor: randomColor(0.5),
        		pointBorderWidth: 1,
        		data: [],
        	};

        	for (var index = 0; index < config.data.labels.length; ++index) {
        		newDataset.data.push(randomScalingFactor());
        	}

        	config.data.datasets.push(newDataset);
        	window.myLine.update();
        });

        $('#addData').click(function() {
        	if (config.data.datasets.length > 0) {
        		var month = MONTHS[config.data.labels.length % MONTHS.length];
        		config.data.labels.push(month);

        		$.each(config.data.datasets, function(i, dataset) {
        			dataset.data.push(randomScalingFactor());
        		});

        		window.myLine.update();
        	}
        });

        $('#removeDataset').click(function() {
        	config.data.datasets.splice(0, 1);
        	window.myLine.update();
        });

        $('#removeData').click(function() {
            config.data.labels.splice(-1, 1); // remove the label first

            config.data.datasets.forEach(function(dataset, datasetIndex) {
            	dataset.data.pop();
            });

            window.myLine.update();
        });
    </script>
0 Comment(s)