Create Bar graph and Pie chart in PDF format using FPDF
Hello friends, I am writing this blog which will help you to create bar graph and pie chart using fpdf. Firstly you need to download fpdf.php file from the following fpdf library. Click here to download. For more details you can go to http://www.fpdf.org/
Once you have downloaded fpdf zip, extract it. Create a new folder inside the directory where you run the project with name pdf and copy fpdf.php from fpdf library and paste it inside pdf folder.
Step 1: Now create file sector.php and paste the following code:
<?php
require('fpdf.php');

class PDF_Sector extends FPDF
{
	function Sector($xc, $yc, $r, $a, $b, $style='FD', $cw=true, $o=90)
	{
		$d0 = $a - $b;
		if($cw){
			$d = $b;
			$b = $o - $a;
			$a = $o - $d;
		}else{
			$b += $o;
			$a += $o;
		}
		while($a<0)
			$a += 360;
		while($a>360)
			$a -= 360;
		while($b<0)
			$b += 360;
		while($b>360)
			$b -= 360;
		if ($a > $b)
			$b += 360;
		$b = $b/360*2*M_PI;
		$a = $a/360*2*M_PI;
		$d = $b - $a;
		if ($d == 0 && $d0 != 0)
			$d = 2*M_PI;
		$k = $this->k;
		$hp = $this->h;
		if (sin($d/2))
			$MyArc = 4/3*(1-cos($d/2))/sin($d/2)*$r;
		else
			$MyArc = 0;
		//first put the center
		$this->_out(sprintf('%.2F %.2F m',($xc)*$k,($hp-$yc)*$k));
		//put the first point
		$this->_out(sprintf('%.2F %.2F l',($xc+$r*cos($a))*$k,(($hp-($yc-$r*sin($a)))*$k)));
		//draw the arc
		if ($d < M_PI/2){
			$this->_Arc($xc+$r*cos($a)+$MyArc*cos(M_PI/2+$a),
						$yc-$r*sin($a)-$MyArc*sin(M_PI/2+$a),
						$xc+$r*cos($b)+$MyArc*cos($b-M_PI/2),
						$yc-$r*sin($b)-$MyArc*sin($b-M_PI/2),
						$xc+$r*cos($b),
						$yc-$r*sin($b)
						);
		}else{
			$b = $a + $d/4;
			$MyArc = 4/3*(1-cos($d/8))/sin($d/8)*$r;
			$this->_Arc($xc+$r*cos($a)+$MyArc*cos(M_PI/2+$a),
						$yc-$r*sin($a)-$MyArc*sin(M_PI/2+$a),
						$xc+$r*cos($b)+$MyArc*cos($b-M_PI/2),
						$yc-$r*sin($b)-$MyArc*sin($b-M_PI/2),
						$xc+$r*cos($b),
						$yc-$r*sin($b)
						);
			$a = $b;
			$b = $a + $d/4;
			$this->_Arc($xc+$r*cos($a)+$MyArc*cos(M_PI/2+$a),
						$yc-$r*sin($a)-$MyArc*sin(M_PI/2+$a),
						$xc+$r*cos($b)+$MyArc*cos($b-M_PI/2),
						$yc-$r*sin($b)-$MyArc*sin($b-M_PI/2),
						$xc+$r*cos($b),
						$yc-$r*sin($b)
						);
			$a = $b;
			$b = $a + $d/4;
			$this->_Arc($xc+$r*cos($a)+$MyArc*cos(M_PI/2+$a),
						$yc-$r*sin($a)-$MyArc*sin(M_PI/2+$a),
						$xc+$r*cos($b)+$MyArc*cos($b-M_PI/2),
						$yc-$r*sin($b)-$MyArc*sin($b-M_PI/2),
						$xc+$r*cos($b),
						$yc-$r*sin($b)
						);
			$a = $b;
			$b = $a + $d/4;
			$this->_Arc($xc+$r*cos($a)+$MyArc*cos(M_PI/2+$a),
						$yc-$r*sin($a)-$MyArc*sin(M_PI/2+$a),
						$xc+$r*cos($b)+$MyArc*cos($b-M_PI/2),
						$yc-$r*sin($b)-$MyArc*sin($b-M_PI/2),
						$xc+$r*cos($b),
						$yc-$r*sin($b)
						);
		}
		//terminate drawing
		if($style=='F')
			$op='f';
		elseif($style=='FD' || $style=='DF')
			$op='b';
		else
			$op='s';
		$this->_out($op);
	}

	function _Arc($x1, $y1, $x2, $y2, $x3, $y3 )
	{
		$h = $this->h;
		$this->_out(sprintf('%.2F %.2F %.2F %.2F %.2F %.2F c',
			$x1*$this->k,
			($h-$y1)*$this->k,
			$x2*$this->k,
			($h-$y2)*$this->k,
			$x3*$this->k,
			($h-$y3)*$this->k));
	}
}
?>
Step 2: Now create diag.php inside pdf folder and write the following code:
<?php
require('sector.php');

class PDF_Diag extends PDF_Sector {
	var $legends;
	var $wLegend;
	var $sum;
	var $NbVal;

	function PieChart($w, $h, $data, $format, $colors=null)
	{
		$this->SetFont('Courier', '', 10);
		$this->SetLegends($data,$format);

		$XPage = $this->GetX();
		$YPage = $this->GetY();
		$margin = 2;
		$hLegend = 5;
		$radius = min($w - $margin * 4 - $hLegend - $this->wLegend, $h - $margin * 2);
		$radius = floor($radius / 2);
		$XDiag = $XPage + $margin + $radius;
		$YDiag = $YPage + $margin + $radius;
		if($colors == null) {
			for($i = 0; $i < $this->NbVal; $i++) {
				$gray = $i * intval(255 / $this->NbVal);
				$colors[$i] = array($gray,$gray,$gray);
			}
		}

		//Sectors
		$this->SetLineWidth(0.2);
		$angleStart = 0;
		$angleEnd = 0;
		$i = 0;
		foreach($data as $val) {
			$angle = ($val * 360) / doubleval($this->sum);
			if ($angle != 0) {
				$angleEnd = $angleStart + $angle;
				$this->SetFillColor($colors[$i][0],$colors[$i][1],$colors[$i][2]);
				$this->Sector($XDiag, $YDiag, $radius, $angleStart, $angleEnd);
				$angleStart += $angle;
			}
			$i++;
		}

		//Legends
		$this->SetFont('Courier', '', 10);
		$x1 = $XPage + 2 * $radius + 4 * $margin;
		$x2 = $x1 + $hLegend + $margin;
		$y1 = $YDiag - $radius + (2 * $radius - $this->NbVal*($hLegend + $margin)) / 2;
		for($i=0; $i<$this->NbVal; $i++) {
			$this->SetFillColor($colors[$i][0],$colors[$i][1],$colors[$i][2]);
			$this->Rect($x1, $y1, $hLegend, $hLegend, 'DF');
			$this->SetXY($x2,$y1);
			$this->Cell(0,$hLegend,$this->legends[$i]);
			$y1+=$hLegend + $margin;
		}
	}

	function BarDiagram($w, $h, $data, $format, $color=null, $maxVal=0, $nbDiv=4)
	{
		$this->SetFont('Courier', '', 10);
		$this->SetLegends($data,$format);

		$XPage = $this->GetX();
		$YPage = $this->GetY();
		$margin = 2;
		$YDiag = $YPage + $margin;
		$hDiag = floor($h - $margin * 2);
		$XDiag = $XPage + $margin * 2 + $this->wLegend;
		$lDiag = floor($w - $margin * 3 - $this->wLegend);
		if($color == null)
			$color=array(155,155,155);
		if ($maxVal == 0) {
			$maxVal = max($data);
		}
		$valIndRepere = ceil($maxVal / $nbDiv);
		$maxVal = $valIndRepere * $nbDiv;
		$lRepere = floor($lDiag / $nbDiv);
		$lDiag = $lRepere * $nbDiv;
		$unit = $lDiag / $maxVal;
		$hBar = floor($hDiag / ($this->NbVal + 1));
		$hDiag = $hBar * ($this->NbVal + 1);
		$eBaton = floor($hBar * 80 / 100);

		$this->SetLineWidth(0.2);
		$this->Rect($XDiag, $YDiag, $lDiag, $hDiag);

		$this->SetFont('Courier', '', 10);
		$this->SetFillColor($color[0],$color[1],$color[2]);
		$i=0;
		foreach($data as $val) {
			//Bar
			$xval = $XDiag;
			$lval = (int)($val * $unit);
			$yval = $YDiag + ($i + 1) * $hBar - $eBaton / 2;
			$hval = $eBaton;
			$this->Rect($xval, $yval, $lval, $hval, 'DF');
			//Legend
			$this->SetXY(0, $yval);
			$this->Cell($xval - $margin, $hval, $this->legends[$i],0,0,'R');
			$i++;
		}

		//Scales
		for ($i = 0; $i <= $nbDiv; $i++) {
			$xpos = $XDiag + $lRepere * $i;
			$this->Line($xpos, $YDiag, $xpos, $YDiag + $hDiag);
			$val = $i * $valIndRepere;
			$xpos = $XDiag + $lRepere * $i - $this->GetStringWidth($val) / 2;
			$ypos = $YDiag + $hDiag - $margin;
			$this->Text($xpos, $ypos, $val);
		}
	}

	function SetLegends($data, $format)
	{
		$this->legends=array();
		$this->wLegend=0;
		$this->sum=array_sum($data);
		$this->NbVal=count($data);
		foreach($data as $l=>$val)
		{
			$p=sprintf('%.2f',$val/$this->sum*100).'%';
			$legend=str_replace(array('%l','%v','%p'),array($l,$val,$p),$format);
			$this->legends[]=$legend;
			$this->wLegend=max($this->GetStringWidth($legend),$this->wLegend);
		}
	}
}
?>
Step 3: Finally create index.php file inside pdf folder and write the following code:
<?php
require('diag.php');

$pdf = new PDF_Diag();
$pdf->AddPage();

$data = array('Men' => 1510, 'Women' => 1610, 'Children' => 1400);

//Pie chart
$pdf->SetFont('Arial', 'BIU', 12);
$pdf->Cell(0, 5, '1 - Pie chart', 0, 1);
$pdf->Ln(8);

$pdf->SetFont('Arial', '', 10);
$valX = $pdf->GetX();
$valY = $pdf->GetY();
$pdf->Cell(30, 5, 'Number of men:');
$pdf->Cell(15, 5, $data['Men'], 0, 0, 'R');
$pdf->Ln();
$pdf->Cell(30, 5, 'Number of women:');
$pdf->Cell(15, 5, $data['Women'], 0, 0, 'R');
$pdf->Ln();
$pdf->Cell(30, 5, 'Number of children:');
$pdf->Cell(15, 5, $data['Children'], 0, 0, 'R');
$pdf->Ln();
$pdf->Ln(8);

$pdf->SetXY(90, $valY);
$col1=array(100,100,255);
$col2=array(255,100,100);
$col3=array(255,255,100);
$pdf->PieChart(100, 35, $data, '%l (%p)', array($col1,$col2,$col3));
$pdf->SetXY($valX, $valY + 40);

//Bar diagram
$pdf->SetFont('Arial', 'BIU', 12);
$pdf->Cell(0, 5, '2 - Bar diagram', 0, 1);
$pdf->Ln(8);
$valX = $pdf->GetX();
$valY = $pdf->GetY();
$pdf->BarDiagram(190, 70, $data, '%l : %v (%p)', array(255,175,100));
$pdf->SetXY($valX, $valY + 80);

$pdf->Output();
?>
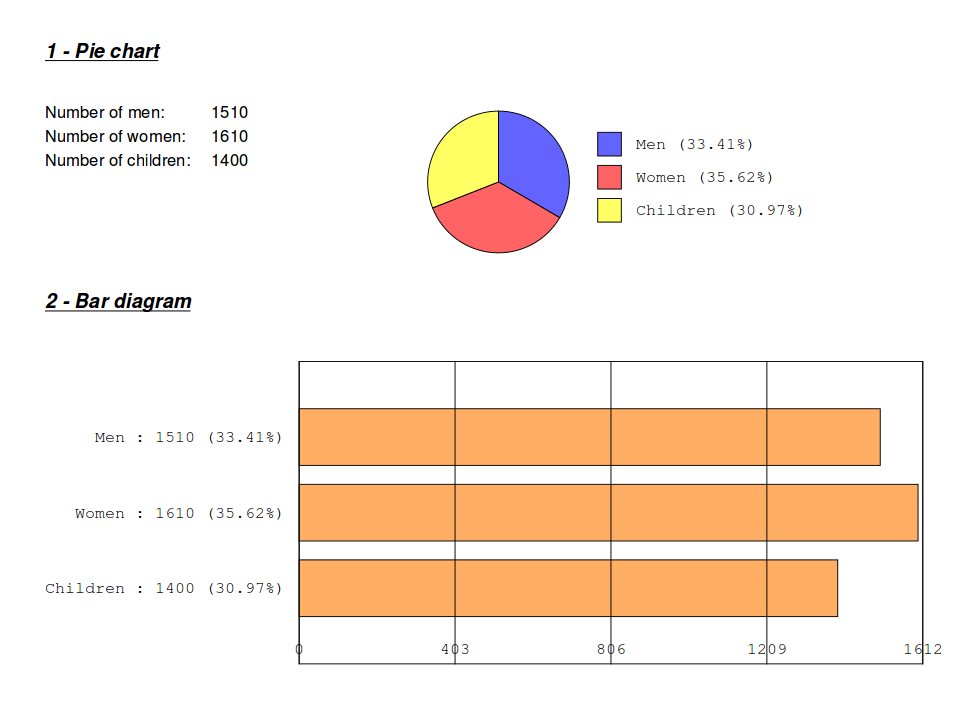
Now, all done, run following url: http://localhost/pdf/ to see the output:

Thanks for reading.
0 Comment(s)