-
Creating Charts and Graphs in Rails
almost 9 years ago
Creating Charts and Graphs in Rails
Few days back I was working on a project, in which a dashboard was needed with stats showing in different kinds of charts. i.e: pie chart, barchart etc. So I looked for a gem that can include all of them and make my work easy. So I got a great gem called "chartkick", you will just need to install this and it will provide so many types of customized representation of data in different kinds of chart/graphs. Lets take an example where there is an event going on. in which we need to show different kinds of charts like-
a) A chart showing category of people hosts, guests and event_organizers. For this we will need a pie chart.
b) A chart showing the registration of the users for the event datewise like a line chart
c) And a chart detailing the total expenses done by the users of different category in a bar chart manner
So here using the chartkick gem we will implement all these types of chart:
First we need to install chartkick gem, so place the chartkick gem in your Gemfile and run the bundlegem "chartkick"Now lets achieve all of our requirements one by one:
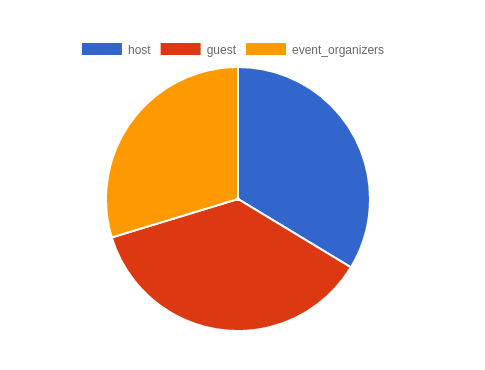
a) Pie Chart:
In this we will show the category of the users in a pie chart. So if we have a column named user_type that stores the user category, we will just write this helper in the view and will create a pie chart of us:
<%= pie_chart User.group(:user_type).count %>So the pie chart will look something like this:
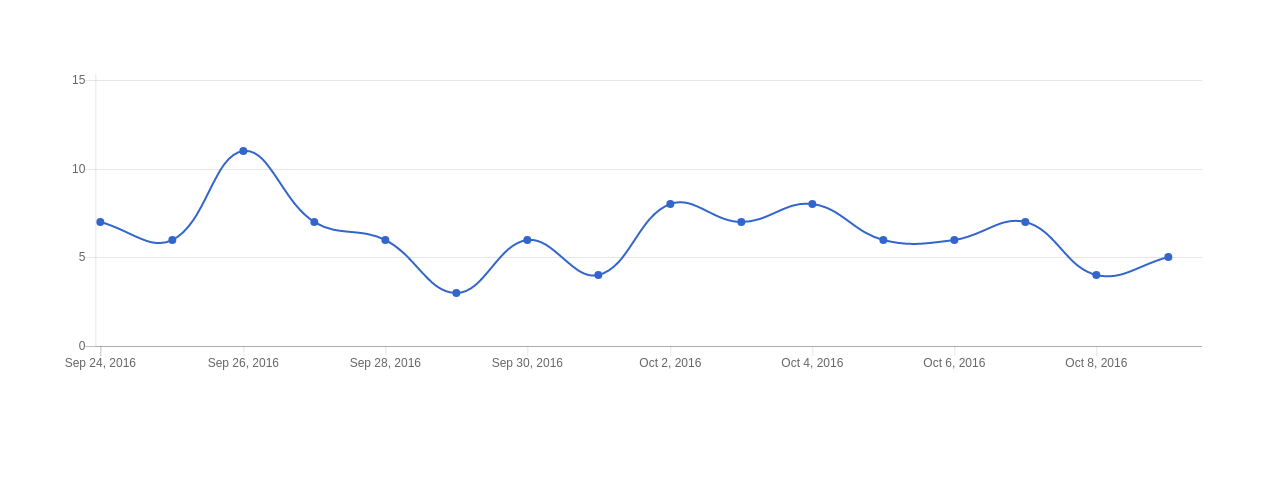
b) Line Chart:
In case of line chart showing the user registration date wise, we will write this helper method of chartkick:
<%= line_chart User.group_by_day(:created_at).count %>For using group_by_day method, you need to install 'groupdate' gem.
So the line chart will look something like this:
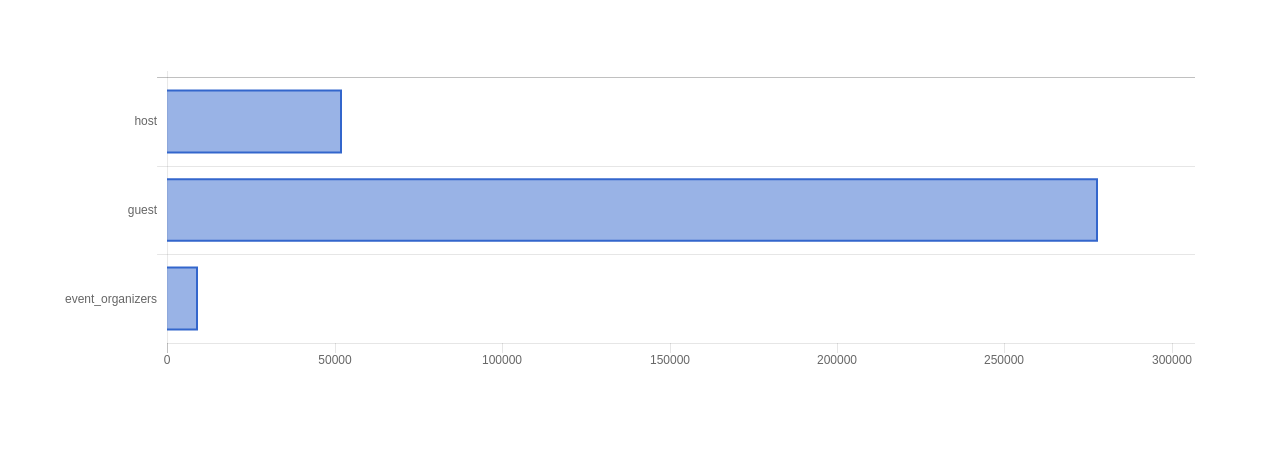
c) Bar Chart:
To show the total expenses of different category of users in a bar chart format, we again just need to write a single line in a view like:
<%= bar_chart User.group(:user_type).sum(:expense) %>Thus the bar chart will look something like this:
There are plenty of customizations available, that you can find at http://chartkick.com/. Hope you liked reading this blog.


0 Comment(s)