-
How to use chart control in asp.net
almost 9 years ago
Hello all,
Working with asp.net, at times, we have to show graphical reports user which can be implemented using Chart like Area Chart, Bar Chart, Box Plot Chart, Bubble Chart, Column Chart, Doughnut Chart, Line Chart, Pie Chart etc.
In my project I used Doughnut Chart control which can be integrated by using following code block:
In ASPX we have :
<%@ Page Title="" Language="C#" MasterPageFile="~/Master.master" AutoEventWireup="true" CodeFile="Report.aspx.cs" Inherits="_Report" %>

<%@ Register Assembly="AjaxControlToolkit" Namespace="AjaxControlToolkit" TagPrefix="asp" %>
<%@ Register Assembly="System.Web.DataVisualization, Version=4.0.0.0, Culture=neutral, PublicKeyToken=31bf3856ad364e35" Namespace="System.Web.UI.DataVisualization.Charting" TagPrefix="asp" %>

<asp:Content ID="Content2" ContentPlaceHolderID="MainContent" runat="Server">
    <asp:UpdatePanel ID="up1" runat="server">
        <ContentTemplate>
            <asp:Panel ID="pnlChart" runat="server">
                <div style="width: 99.9%; margin: 0 auto; text-align: center; margin-top: 10px;">
                    <asp:Chart ID="Chart2" runat="server" Width="800px" Height="600px">
                        <Titles>
                            <asp:Title ShadowOffset="0" Name="Items" />
                        </Titles>
                        <Legends>
                            <asp:Legend Alignment="Center" Docking="Bottom" IsTextAutoFit="true" Name="Default"
                                LegendStyle="Table" />
                        </Legends>
                        <Series>
                            <asp:Series Name="Series1" Font="Malgin Gothic" ChartType="Doughnut" LabelForeColor="Black"
                                CustomProperties="MinimumRelativePieSize=50, CollectedSliceExploded=True, CollectedLegendText=OTHER, CollectedColor=ActiveBorder, CollectedLabel=OTHER   (#VALY)  (#PERCENT{P2}), PieLabelStyle=Outside, CollectedThreshold=1"
                                YValueType="Int32" Label="#VALX" XValueType="String" YValuesPerPoint="4">
                            </asp:Series>
                        </Series>
                        <ChartAreas>
                            <asp:ChartArea Name="ChartArea1" BorderWidth="0">
                            </asp:ChartArea>
                        </ChartAreas>
                    </asp:Chart>
                </div>
            </asp:Panel>
        </ContentTemplate>
    </asp:UpdatePanel>
</asp:Content>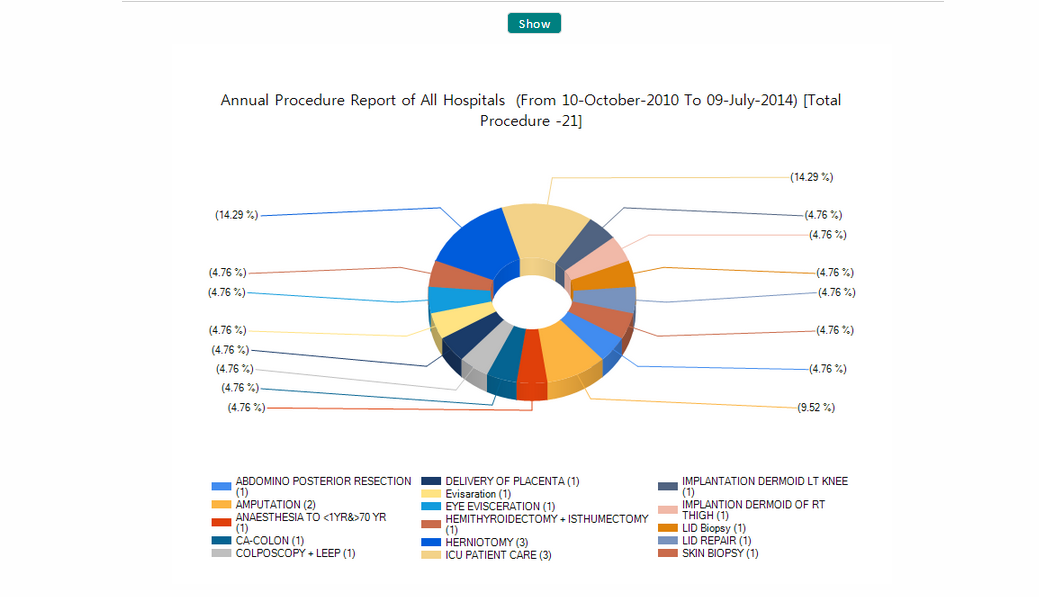
Note : by changing the ChartType property to Area, BoxPlot, Polar, we can show different types of Charts.
In Code behind we have:
using System;
using System.Drawing;
using System.Data;
using System.Web.UI.DataVisualization.Charting;

public partial class _Report : System.Web.UI.Page
{
    protected void Page_Load(object sender, EventArgs e)
    {
        if (!IsPostBack)
        {
        }
    }
    protected void showReport()
    {
        DataTable dataTable = new DataTable();
        dataTable = // Your data access code goes here which reuturns DataTable
        if(dataTable.Rows.Count > 0)
        {
            myChart.DataSource = dataTable;
            myChart.Series["Series1"].XValueMember = "name"; // Your Column name present in DataTable
            myChart.Series["Series1"].YValueMembers = "id";   // Your Column name present in DataTable
            myChart.DataBind();
            myChart.ChartAreas["ChartArea1"].Area3DStyle.Enable3D = true;
            myChart.Legends[0].Docking = Docking.Bottom;
            int i = 0;
            foreach (DataRow dataRow in dataTable.Rows)
            {
                myChart.Series["Series1"].Points[i].LegendText = "#VALX" + " (" + dataRow["total"].ToString() + ")";
                myChart.Series["Series1"].Label = "(#PERCENT)";
                i++;
            }
            Title Area1Title = new Title("Report Title", Docking.Top, new Font("Malgun Gothic", 13), Color.Black);
            myChart.Titles.Add(Area1Title);
        }
    }

    protected void btnshow_Click(object sender, EventArgs e)
    {
        showReport();
    }
}
Note: myChart.ChartAreas["ChartArea1"].Area3DStyle.Enable3D = true;
This allows us to set the visual property of the chart which show the Chart in 3 Dimensional form.
In Web.Config we have :
<system.web>
    <httpHandlers>
      <add path="ChartImg.axd" verb="GET,HEAD,POST" type="System.Web.UI.DataVisualization.Charting.ChartHttpHandler, System.Web.DataVisualization, Version=4.0.0.0, Culture=neutral, PublicKeyToken=31bf3856ad364e35" validate="false" />
    </httpHandlers>
</system.web>


0 Comment(s)