-
How to trace SQL query or SP on a page
over 9 years ago
HI Guys,
Some times we want to know that what SQL operation is running on a particular page or a event, then we have to debug our code base and we get the result, but it's time taking process to debug code line by line and as well as some time we don't have our code base but only access on SQL.
SO we can over come to this problem by using SQL Server Profiler.
SQL Server Profiler :-
SQL Server Profiler tell's us the list of event trigger on a page, such as which function is called, Which SP is called and what was the output, we can also apply some filter here like Database ID, Database Name, duration of Trace, Login name etc.
1.) Firstly we need to know the Database Id of our database as below.

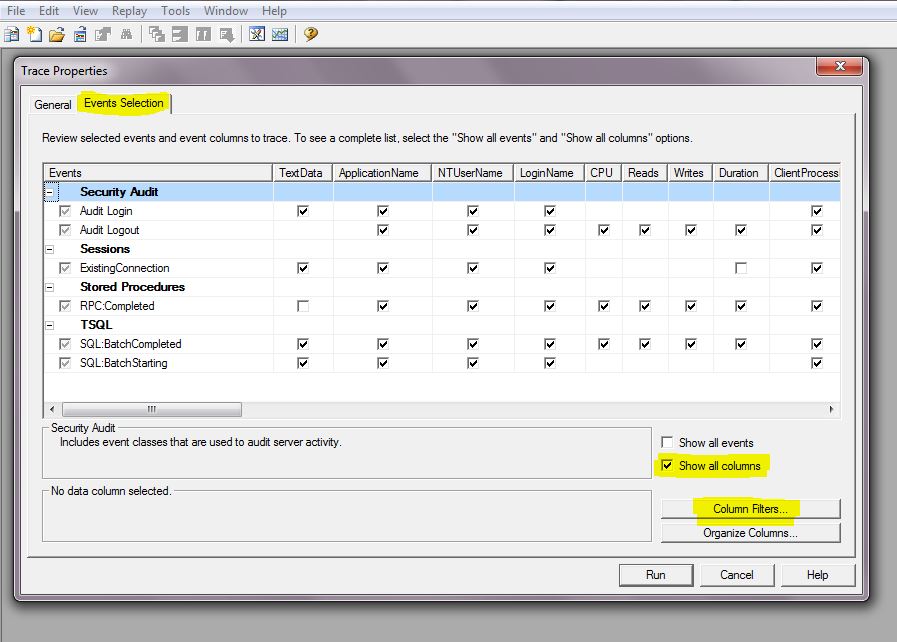
2.) Now open SQL Server Profiler from tool menu. After connecting a new Trace popup will open. In popup, go to Event selection tab, select the Show all column checkbox and click column filter button.
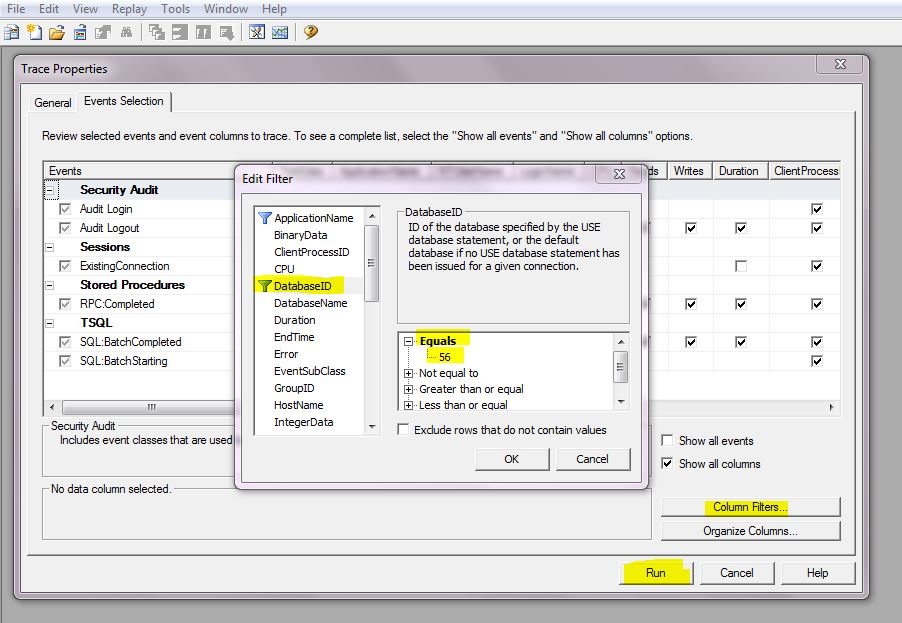
3.) Here we have different filter, we apply DatabaseId filter here and need to enter our Database Id which is 56 in our case and RUN the trace.
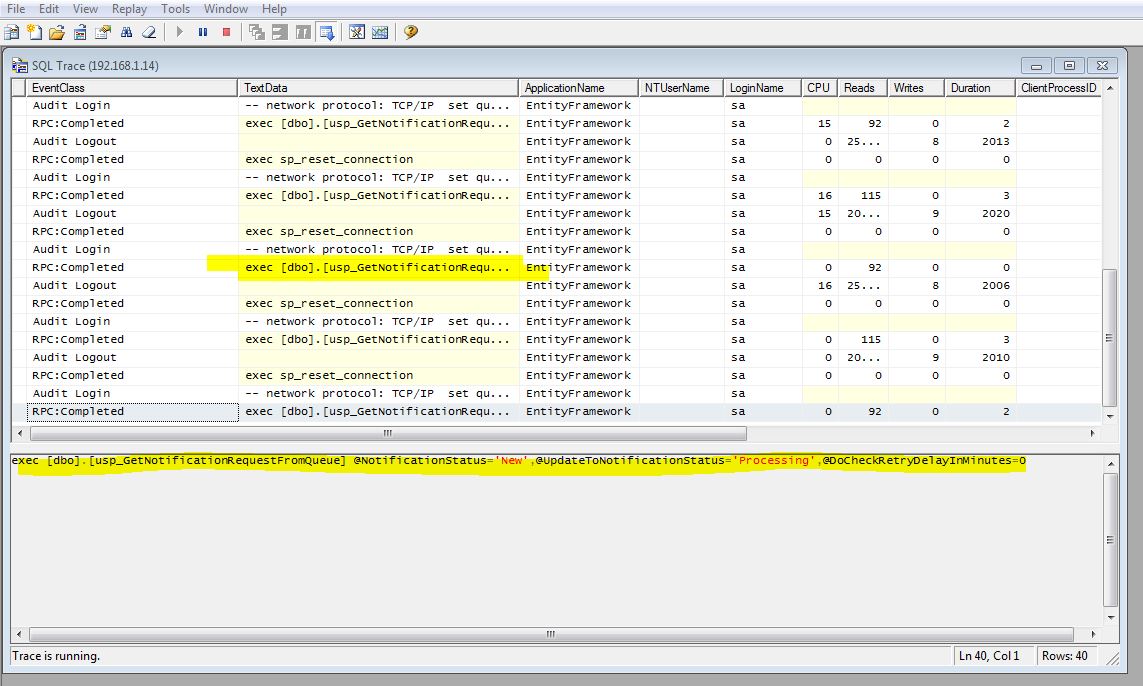
4.) Here we can see all SQL query which are running on event trigger as button click, page load.


0 Comment(s)