-
How to print the stack trace using symbolic Breakpoint
about 9 years ago
Hi Readers,
When You find any runtime conflict in your constraints while running the app and you are not able to find the place where the conflict is.
Then, making a symbolic breakpoint and printing the stack trace can be very helpful.
Below are the steps via which you can make a symbolic breakpoint.
- In the bottom-left corner of the breakpoint navigator, click the Add button.
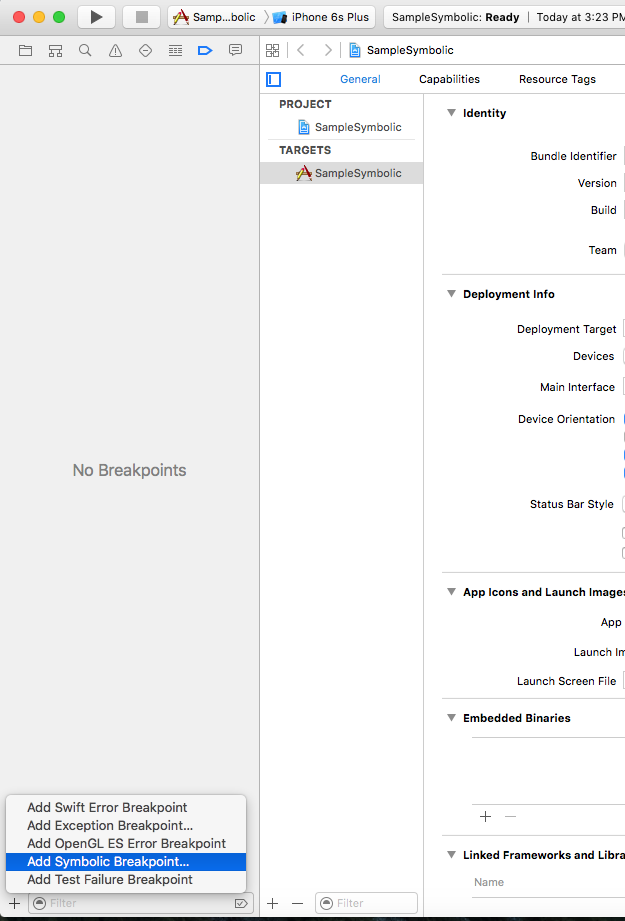
- Choose Add Symbolic Breakpoint from the menu.
- Enter the details, as shown in the screen-shot.
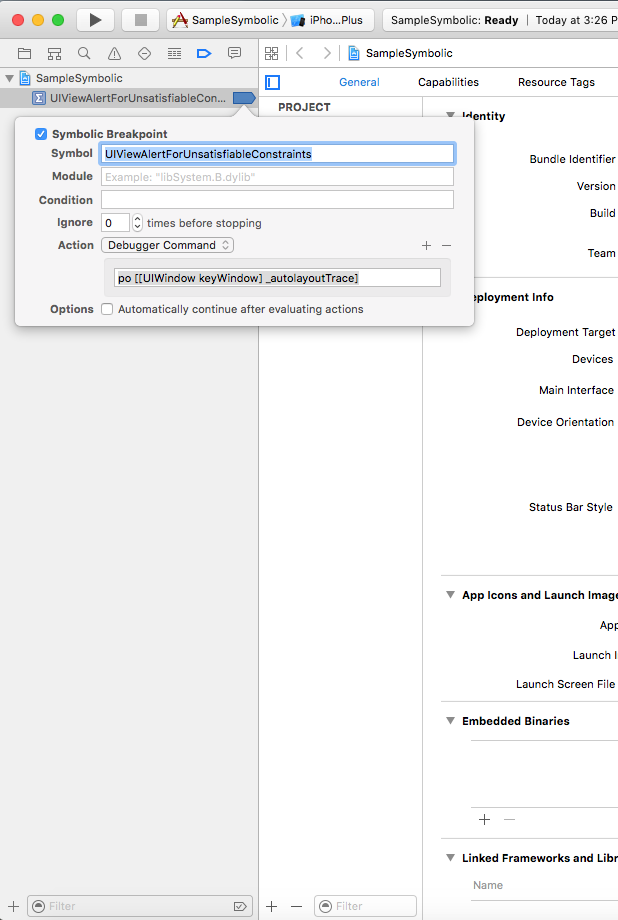
-
Click Anywhere, (You have successfully created symbolic Breakpoint with the Action of printing the stack trace "po [[UIWindow keyWindow] _autolayoutTrace]")
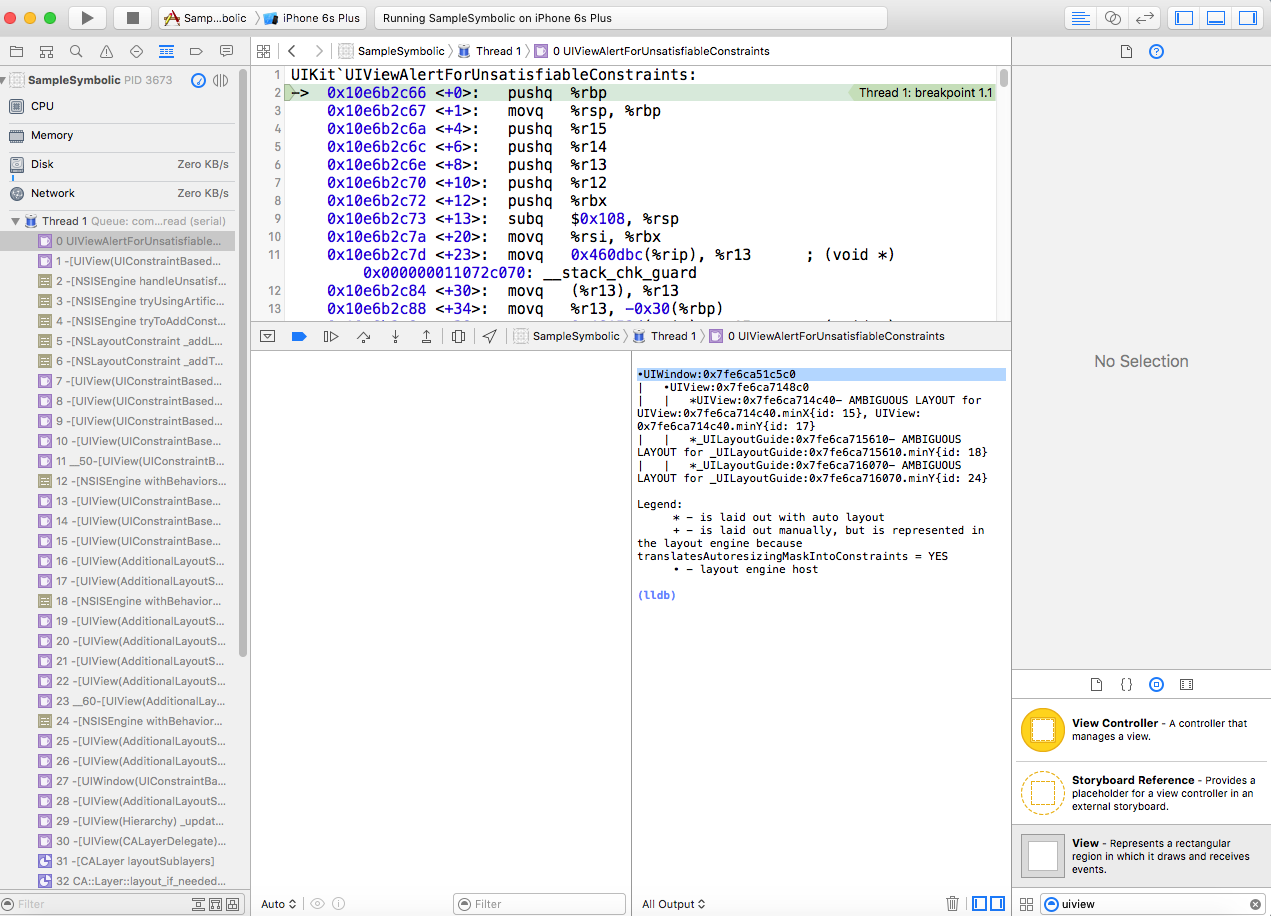
- Now run the app, on the screen where the conflict occurs the symbolic breakpoint automatically gets called and will print the stack trace in which you can see the referenced view in which the conflict occurs.
Thank for Reading
Keep Coding.:)


0 Comment(s)